


Seismology
At the Kövesligethy Radó Seismological Observatory, we investigate the structure of the earth crust and upper mantle beneath the Pannonian basin, the source processes of local earthquakes and the seismicity of Hungary.
The Pannonian depression is an extensional back-arc basin in central Europe and is an integral part of the Alpine-Carpathian orogenic mountain belts. It can be characterized by thinned lower crust, shallow Moho discontinuity, high surface heat flow and Moho temperature, implying recent active tectonic processes. Imaging the velocity structure of the earth crust and upper mantle may help us to better understand the structure and formation of the Pannonian region. To achieve this goal, we use travel-times from local, regional and teleseismic earthquakes to tomographically image the three-dimensional (3D) P-wave velocity variations beneath the Pannonian basin. For constructing the 3D S-wave velocity model of the basin, we apply both surface wave and ambient noise tomography. To map the topography of the crust-mantle boundary (Moho) and the lithosphere-asthenosphere boundary (LAB), we perform receiver function analysis.
The focal mechanisms of small earthquakes can be used to infer the structure and kinematics of faults at depth and to constrain the crustal stress field in which the earthquakes occur. For this reason we determine mechanisms of small events as accurately as possible by waveform inversion or by jointly inverting waveforms and polarity data.
Accurate earthquake locations are a prerequisite of reliable structural research and seismic hazard studies. For precise earthquake location we use the iLoc algorithm, one of the most advanced single-event location algorithms.
The great amount of seismological data necessary for the above described research are provided by the temporal AlpArray Seismic Network as well as the permanent seismic stations operational in Hungary and its neighborhood.
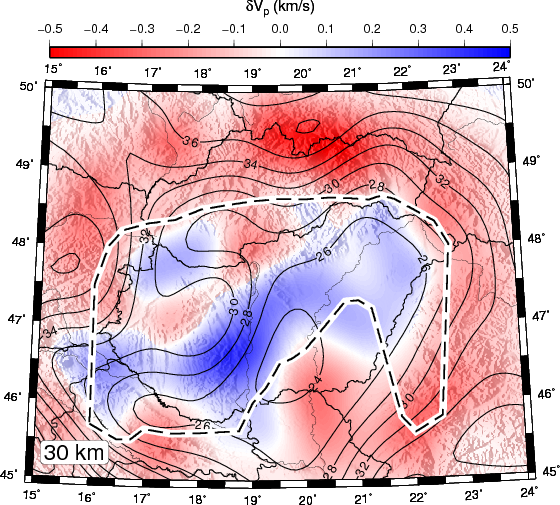
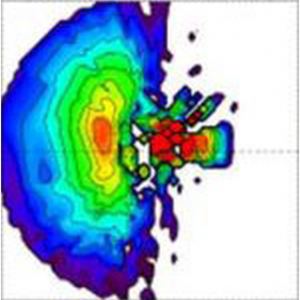
P-wave velocity anomaly map at 30 km depth based on earthquake travel-time data. The dashed line indicates the reliable area derived from checkerboard tests. The contour lines show the Moho depth map.
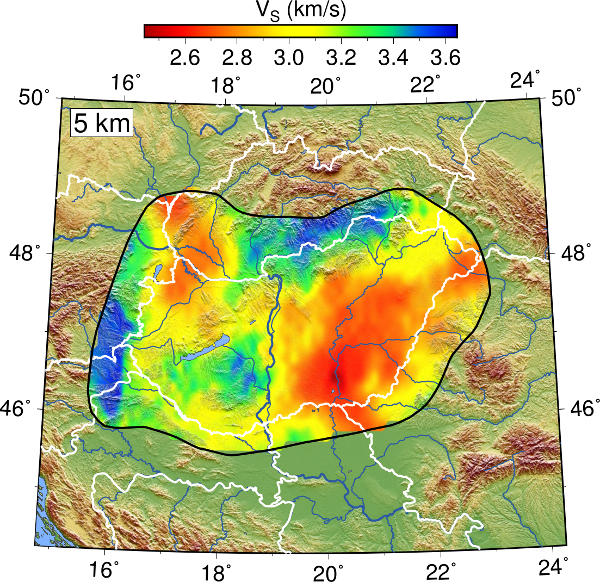
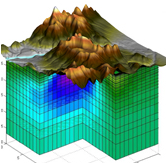
S-wave velocities at 5 km depth derived from microseismic noise.